As we approach the All-Star Break in baseball, some statistics stand out as having returned to pre-steroids era normalcy. Here's a look at where the eventual leaders were in 1988 and 1988 after 88 games (or thereabouts for pitchers), compared to where the current leader in each category stands.
Home Runs
1988 - Jose Canseco - 24 (led league with 42)
1998 - Mark McGwire - 37 (led league with 70)
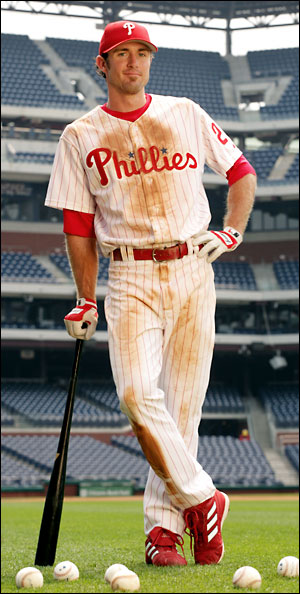
2008 - Chase Utley - 24
Sammy Sosa
RBIs
1988 - Jose Canseco - 67 (led league with 124)
1998 - Sammy Sosa - 83 (led league with 158)
2008 - Josh Hamilton - 84
Batting Avg
1988 - Wade Boggs - .358 (ended year at .366)
1998 - Larry Walker - .335 (ended year at .363)
2008 - Chipper Jones - .388
Wins
1988 - Frank Viola - 15 (led league with 24)
1998 - Tom Glavine, Roger Clemens, David Cone, Rick Helling
scr- 12, 9, 13, 12 (all led league with 20)
2008 - Brandon Webb, Joe Saunders - 12
ERA
1988 - Joe Magrane - 2.50 (led league with 2.18)
1998 - Greg Maddux - 1.54 (led league with 2.22)
2008 - Justin Duchscherer - 1.96
Strikeouts
1988 - Roger Clemens - 202 (led league with 291)
1998 - Curt Schilling - 189 (led league with 300)
2008 - Tim Lincecum - 122
(NOTE: Sabathia has 123 but his total resets upon joining the NL/Brewers)
Innings Pitched
1988 - Dave Stewart - 156 2/3 (led league with 275 2/3)
1998 - Curt Schilling - 154 (led league with 268 2/3)
2008 - Roy Hallday - 137 1/3


7 Responses:
What are we supposed to be seeing here? Other than HR, none of the stats show a low-high-low pattern (ERA shows a pattern, but in the wrong direction for the steroids narrative).
Based on those stats, what steroid era?
I wanted to leave it open to interpretation, but I think the only stats that could be directly attributable to steroids are homers and pitching strikeouts.
The drop-off in pitching strikeouts could be attributable to roided-up hitters overswinging, as well as roided-up pitchers throwing harder. On the other hand, Clemens in 1988 and Schilling in 1998 had a couple of the best pitching seasons of all time, so it's hard to say.
Some of the stats are interesting because they haven't changed much.
I think it would be a lot more telling to see graphs of the past 20 years instead of just the 3 data points. But that would be a lot of work, and we're third rate baseball nerds.
It took me over an hour just to round up what I got. The graphs would be a lot easier based on year-end stats, rather than in-season splits.
I don't think anyone has worn those jeans since 1988.
Bonus points for the black dress belt.
Post a Comment